Pressure profiles in silos for bulk solids
How is the pressure in silos varying with height ?
How to calculate the pressure as a function of depth in a silo ?
Question or remark ? Please contact us at admin@powderprocess.net
| Section summary |
|---|
| 1. Pressure
profiles in silo |
| 2. Calculation of
pressure in silos : mass flow silos |
| 3. Calculation of
pressure in silos : funnel flow silos |
| 4. Conclusions |
The storage of bulk solids is very different than the storage of a liquid. The flow of bulk solid is specific but the pressure that bulk solid is creating within a silo is also very far from the simple hydrostatic pressure calculated for liquids. However understanding how the pressure profile develops within a silo, and what is its maximum, is absolutely key for designers aiming at producing a safe silo for a given material. This page is explaining what is the usual profile of pressure within bulk solids silos, how it changes depending on whether the silo is filling, static or discharging, and how to estimate (calculate) the pressure profile.
Note that the article is mainly qualitative and the equations given are here to roughly model the phenomena observed in reality, it can by no means be considered a design guide, for the detail design of a silo is only accepted way is to refer to publish norms (DIN, ISO...).
The calculation of the pressure profile in silo requires the preliminary determination of the flow properties of the bulk solids thanks to shear tester (Jenike cells), please refer here for more infos : Shear cells testing to measure flowability : Step by Step Guide
1. Pressure profiles in silo
How does pressure develop in a silo holding bulk solids
(granules, pellets, powder...)
1.1 Static (no flow is happening)
The 1st thing to understand when discussing pressure in silos is that there is not a unique pressure to consider but two. Indeed, the pressure within the bulk of solids (vertical pressure) is different than the pressure that is applied on the walls of the silos (wall pressure). This is an important distinction to make, especially when designing silos.
The pressure is of course not constant within the silo but it is very different from the 1st intuition that would be to consider that it increasing linearly with the depth, like it is in hydrostatic. It is also fundamental to make the difference in between a silo whose content is static (no flow) and a silo that is discharging (flow) as the pressure profile is changing radically.
")
When there is no flow, the pressure profile in a silo has the following characteristics :
- It increases with the depth (height from the top of the silo)
- It is changing pattern depending on the section of the silo : the pressure profile within the vertical bin section is different than in the hopper section
- Within the vertical bin section the pressure does not increase linearly but tends to an asymptote.
- Within the hopper section, the pressure increases linearly. However it starts from the pressure at the bottom of the vertical bin section, which means that the total pressure within the hopper section is much lower than what would be created by the total weight of solids stored, it is explained by the fact that some of the weight is actually supported by the side walls.
1.2 Discharge (flow is happening)
When flow is taking place out of the silo, the pressure profile is changing radically. A transition point is happening in between the top part of the silo, which has still a pressure profile equal to the static situation, and the bottom part of the silo. The pressure is increasing dramatically at the transition point (often situation near the hopper begins) and then decreases down to 0 near the outlet of the silo.
")
When there is flow, the pressure profile in a silo has then the following characteristics :
- The upper vertical section of the silo has a pressure profile similar to the static situation
- The pressure profile is changing suddenly at a point of transition
- For mass flow silos, the point of transition is the connection in between the vertical bin section (top) and the hopper section (bottom)
- At the point of transition vertical pressure and wall pressure can increase dramatically
- Below the point of transition the pressure decreases until 0 at the outlet
1.3 Risks of silo failure
It is very important to understand that the pressure at the transition can be much higher than the pressure calculated in static conditions. It means that the silo must be designed to handled those extra pressure to the wall near the point of transition, if it is not the case then the silo will ultimately fail and rupture. This is a very common cause of silo failure, the Engineer must follow the proper norms of construction to calculate the appropriate maximum pressures the silo will have be to handle, even when having a proven silo but for example having to change the bulk solids to be handled, such calculation should be done to make sure the design remain adequate with the new forces that will be applied by the new bulk solids.
The sections below provide some basics on the calculation of pressure in silo but are by no means sufficient for detail design and construction, only norms must be applied.
2. Calculation of pressure in silos : mass flow silos
2.1 Models and formula
The models and formula shown here are mainly from Jansen, Jenike and Walker, they are reported in [Shamlou].
2.1.1 Initial filling and static storage
2.1.1.1 Vertical section
The pressures can be modeled thanks to Jansen equations :
Pv = ρb.g.A/μ.K.C[1-e-(K.μ.C/A).h)]
Pw = Pv.K
K = (1-sin φ)/(1+sin φ) = tan2(π/4-φ/2)
")
With
Pv = Vertical pressure within the fill
ρb = bulk solids density
g = acceleration due to gravity
A = cross sectional area of the bin
μ = coefficient of wall friction (tan φw)
K = ratio of lateral to normal pressure in the bin
C = circumference of the bin
h = height
Pw = lateral wall pressure
φ = angle of internal friction
φw = angle of wall friction
2.1.1.2 Hopper section
The pressures can be modeled thanks to Walker equations :
Pv = ρb.g.[(Pvo/ρb.g) + h]
Pw = Pv.K
K = tan α / (tan φw + tan α)
With
Pv = Vertical pressure within the fill
ρb = bulk solids density
g = acceleration due to gravity
K = ratio of lateral to normal pressure in the bin
h = height
Pw = lateral wall pressure
φw = angle of wall friction
α = hopper half angle
According to literature, these equations tend to overestimate the wall pressure
2.1.2 During discharge
2.1.2.1 Vertical section
The maximum pressure peak at the wall, which happens at the transition from static stress field to dynamic stress field, can be estimated thanks to :
Pw(max) = A.ρb.g/C tan φw[1-(R-Q).tan φw/Mi]
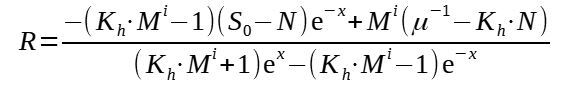
Kh = ν/(1-ν)
S0 = 1/(μ.K.(1-exp(-[μ.K.hs.C/A]))
R+Q = S0-N -> Q = S0-N - R
N = 2ν/μM2(i-1)
M = √(2(1-ν))
ν = K/(1+K) for axisymmetric flow
ν = (K+2-√(4-3K2))/(2(K+1)) for plane flow
Z = H-hs/Mi(A/C)
x = 2i sin(δ/1) - sin δ [sin (2β+α)/sin α + 1]
hs = 0.6H for axisymmetric flow
hs = 0.5H for plane flow
With
Pw = lateral wall pressure
ρb = bulk solids density
g = acceleration due to gravity
A = cross sectional area of the bin
μ = coefficient of wall friction (tan φw)
K = ratio of lateral to normal pressure in the bin
C = circumference of the bin
h = height
Pw = lateral wall pressure
φ = angle of internal friction
φw = angle of wall friction
i = 1 for axisymmetric flow
i = 0 for plane flow
hs = height at which maximum pressure peak occurs
H = bin height
Below the transition, the pressure is considered to be equal to the maximum peak pressure calculated above, for design purposes. Above the transition point and to the top of the silo, the pressure can be estimated via Jansen formula (see 2.1.1.1).
2.1.2.1 Hopper section
The following equations can be used to estimate the pressure observed in the hopper section of a silo during discharge
Pv = ρb.g.h/(K2-1)[1-(h0/h)K2-1] + Pv0(h/h0)K2
Pw = K1*(ρb.g.h/(K2-1)[1-(h0/h)K2-1] + Pv0(h/h0)K2)
K1 = (1 + sin δ cos 2β)/[1- sin δ cos(2α + 2β)]
K2 = 2(K3-1)
K3 = K1[(tan α + tan φw)/tan α]
With
Pv = Vertical pressure within the fill
ρb = bulk solids density
g = acceleration due to gravity
h = height
h0 = height of the converging section of the silo
Pw = lateral wall pressure
Pv0 = vertical surcharge pressure at the top of the
hopper
α = hopper half angle
β = angle between the major principal stress and the normal to
hopper wall
δ = effective angle of internal friction
φw = angle of wall friction
2.2 Limitations
Those formula are mentioned for explanatory purpose of the pressure phenomena happening in silos. They allow to qualitatively represent the pressure variations and the fact that the pressure during discharge is totally different than the pressure in static conditions. However they are not very precise and should not be used as such for silo design. The only admissible way of designing a new silo is to follow norms, construction codes, with updated correlations and proper safety factors, for example :
- DIN1055, Design Loads for Buildings: Loads in Silo Bins, Deutsches Institut fur Normung, Berlin, Germany, 1987.
- AS3774-1996, Loads on Bulk Solids Containers, Standard Association of Australia, Sydney, Australia, 1996
3. Calculation of pressure in silos : funnel flow silos
Funnel flow silos have a much more complex flow pattern than mass flow silos which can make the estimation of pressures in the silos tricky. There are indeed areas of flow, typically at the core of the silos, and areas without flow, on the side, however those borders are not fixed which means that the static parts can actually flow from time to time, which means that the pressure at the wall would then change dramatically from low levels to very high pressures. There are also different geometries for funnel flow silos that will lead to different flow patterns and thus pressure profiles.
- During filling and static storage, the Jansen formula can be used to model the pressure in the silo (see 2.1.1.1)
- During flow :
- Shallow bins and silos (H/D < 2) : the live area is not in contact with the wall, no pressure peak is expected, the Jansen formula (see 2.1.1.1) can be used
- Deep bins and silos (H/D > 5) : there is a transition point in between an area at the top of the silo where the flow is close to mass flow, the pressure can then be estimated thanks to Jenike's equation (see 2.1.2.1). The pressure below the transition point can be assumed to decrease linearly from the transition point to the outlet of the silo. The transition point is not as defined as for mass flow silos and can change depending on the actual geometry of the silo. The pressure at the transition point can be high and must be estimated, [Shamlou] is giving a formula for this purpose
4. Conclusions
The design of a silo is made of several steps. One of the steps
is to define the silo hopper angle and opening size, another step
is to calculate the pressure profile in the silo so that the
structural calculation of the silo can be done properly. This page
is giving some general explanations on how the pressure profiles
develop in silos, as well as some basic models, but considering
that large pressures can potentially develop in silos and lead to
their failures, Engineers must always refer to specialized company
which can use norms to design the bin efficiently.
[Shamlou] Handling of Bulk Solids, P.A. Shamlou, Butterworths,
1988